
We need to understand the value of our natural resources.
TABLE OF CONTENTS
Click on the links below to jump to each section:
How ROE Values Are Calculated
Natural System Services
Natural System Services Methodology
Natural System Services Categories
Natural System Land Cover Types
Air Pollution Removal
Outdoor Recreation
Reduced Healthcare Costs
Property Values
References
_________________________________________________
How ROE Values Are Calculated
The economic value of open space was estimated by measuring impact in five areas:
- Avoided costs associated with natural system services provided by open spaces
- Avoided costs associated with air pollution removal
- Value of open space related to outdoor recreation (e.g., sale of goods and services)
- Avoided healthcare costs associated with healthy lifestyles
- Impact of open space and water on property values (e.g., higher property values and earnings from open-space-related activities)
Building on previous valuation studies, and using standard economic analysis techniques, ROE studies estimate the financial value of open space by measuring the financial impacts of avoided costs from natural system services and air pollution removal, outdoor recreation revenues, avoided healthcare costs as a result of increased exercise, and increased property values due to proximity to open space.
Conservative approaches are used to estimate monetary values. For example, only major recreational activities were included, and not all natural system services. Even with this conservative approach, the analysis is subject to caveats common to any economic valuation or impact analysis. These caveats include substitution effects, double counting, and value transfer (VT).
Substitution effects are important when considering the benefits that residents enjoy by recreating and exercising in local public parks as opposed to a private facility. If all open space were developed, it is unlikely that residents would discontinue the recreational activities they now enjoy, but would instead go elsewhere. Because of this, estimates of recreational value in this study should be understood to represent only the benefits that existing open space provides. Tourism is not a part of this estimate.
Double counting occurs when a value is overstated because it has been derived from two separate analyses. While this study aimed to minimize any double counting, the complexity of natural systems and their interconnections make it difficult to avoid some double counting.
Value transfer (VT) involves the adaptation of existing valuation or data from one location to a similar location. It is used as an alternative strategy when primary research is not possible or justified because of time or budget constraints. While VT is an alternative strategy, it is better than discounting natural system services and implying that their value is zero.
VT is an important tool for policymakers, since it uses existing research to reliably estimate the landscape’s natural system service value for considerably less time and expense than a new primary study. VT information for this report was obtained from the 2011 satellite-derived land cover data from the MRLC Consortium.[1]
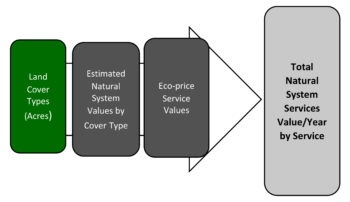
FIGURE 1
VT MODEL FOR NATURAL SYSTEM SERVICES
Natural System Services
Natural system services represent the benefits that human populations derive, directly or indirectly, free of charge from ecosystem functions. Because natural system services are not fully captured in commercial markets or adequately quantified in terms comparable with economic services and manufactured capital, they are often overlooked or undervalued in policy debates and investment decisions.
This component of ROE studies estimates the avoided costs associated with 11 natural system services: groundwater, stormwater and flood mitigation, carbon sequestration, air-pollution removal, wildlife habitat, aquatic habitat, erosion prevention, habitat regeneration, pollination, biological control, and nutrient uptake. These represent natural system services that, if lost, would require costly intervention to replicate at taxpayers’ expense.
Since most services are natural functions, markets for these services do not exist. When there are no explicit markets for the services, more indirect means of assessing values must be utilized, including:
- Avoided cost (AC)
- Contingent valuation (CV)
- Cost of damage (CD)
- Cost of regulation (CR)
- Direct investment in a resource (DI)
- Direct market valuation (DM)
- Market valuation (MV)
- Replacement cost (RC)
- Tax benefits (TB)
- Travel cost (TC)
Natural System Services Methodology
The value of natural system services is a reflection of what price people and governments are willing to pay to conserve, restore, and expand natural resources.[2] This method, developed by Dr. Elliott Campbell, Maryland Department of Natural Resources, is known as eco-pricing and is used in ROE studies to develop a list of natural system services provided by forests, wetlands, and riparian and grassland areas in Pennsylvania. Most of these services do not have established markets, making estimates difficult. These estimates are based primarily on the transfer of data from peer-reviewed studies, as well as data from regulatory fines, nutrient trading, forest replanting, habitat replacement costs, tax benefits, and conservation easement values.
As part of an effort to document eco-prices relevant to Pennsylvania, the following federal and state agencies and other organizations provided information:
- S. Fish and Wildlife Service
- S. Environmental Protection Agency
- S. Forest Service
- Pennsylvania DCNR—Forestry Division
- Pennsylvania Fish and Boat Commission
- Pennsylvania Game Commission
- Maryland Department of Natural Resources
- Water Research Foundation (WRF)
- Hawk Mountain Sanctuary
Campbell (2016) reviewed and summarized over 55 academic studies comprising 210 individual value estimates for the types of ecosystems present in the state of Maryland.[3] Weber reviewed over 80 peer-reviewed articles for Cecil County, MD.[4] Aaron Paul reviewed over 80 articles for Virginia.[5] Costanza reviewed over 100 peer-reviewed articles in a similar study in New Jersey.[6]
Due to the similarity of climate, land cover, and ecosystems in Maryland, New Jersey, and Virginia, this data was relied upon as well. Data from Maryland and New Jersey were used when Pennsylvania data was unavailable. Data from elsewhere in the United States was a third choice.
Figure 2 contains 80 exchanges of money for some form of ecological work, the replacement of ecological work, or cost of damages to an ecosystem service (i.e. eco-prices). Eight economic classifications (investment, replacement cost, avoidance cost, market price, cost of regulation, cost of damages, taxes incurred, and tax benefit) were reviewed.
FIGURE 2
STUDIES REVIEWED BY CAMPBELL, ROGERS, AND COSTANZA
| Natural System Service | Number of Financial Exchanges Used in Developing Eco-prices |
| Groundwater | 5 |
| Nutrient uptake | 17 |
| Stormwater and flood mitigation | 27 |
| Aquatic resources | 3 |
| Habitat | 19 |
| Erosion prevention | 4 |
| Pollination | 3 |
| Biological control | 2 |
In cases where there were a range of values for a given service, the most conservative number was chosen. All dollar figures were transformed to 2017 equivalents, using an online inflation calculator that employs the Consumer Price Index (CPI) from the annual Statistical Abstract of the United States.
These numbers are estimates only and consider several issues, as the data are often not spatially explicit. Some services, like pollination, depend on proximity to crops, yet not all forests are within pollinator range of cropland. The value of flood protection, groundwater recharge, and other services also depends on human demand relative to supply. This ratio tends to be higher in urban areas than rural.
Similarly, not all forest and wetland types provide services equally. For example, many restoration practices are focused on reducing the amount of nitrogen entering waterways. The cost of paying for this can be expressed in terms of $/pound of nitrogen removed. Different natural systems, such as wetlands, forests, and riparian covers, remove nitrogen at different rates on an annual basis.[7]
Other examples include soils and carbon sequestration. More productive soils facilitate faster plant growth and faster uptake of carbon. Some tree species are better at carbon uptake than others.
Using eco-prices, an annual benefit can be calculated for each natural system.
Further, large, contiguous blocks of forest and wetland are more likely to contain fully functioning ecosystems and provide corresponding benefits to humans. Smaller, fragmented ecosystems are more likely to be impaired.[8, 9, 10, 11] Retaining connectivity using configured corridors can help to offset some of the functional losses caused by fragmentation.[12, 13, 14, 15, 16, 17]
Finally, using some services may impair other services. For example, constructing trails for recreation can create more opportunities for invasive species. Proper management is therefore necessary to prevent long-term ecological degradation.
The study group attempted to overcome these concerns in the following ways:
- Each cover type was distinguished by one or more eco-price.
- Eco-prices varied by cover types.
- Position in the landscape distinguished cover types (headwaters versus riparian forests).
- Locational differences were used as separate cover types (urban versus rural).
- Forest size was used to differentiate cover types (750 acres, 500–750 acres, 150–500 acres, and less than 150 acres).
- Current uses or practices, like working forests and developed open space, were used to differentiate cover types.
The total natural system service value of a given type of preserved or undeveloped open space was determined by aggregating the individual natural system service eco-prices associated with each land cover type.
Natural System Services Categories
Water supply and groundwater: Pennsylvania cover types (e.g., forests and wetlands) and their underlying soils help ensure that rainwater is stored and released gradually to streams and rivers, rather than immediately flowing downstream as runoff. As communities grow, the value of infiltration and quality water to residents will continue to be very high. The sources for this eco-price were investment in water supply and the market price of municipal water supplies in Pennsylvania and Maryland.[18, 19, 20]
Nutrient uptake: Forests and wetlands provide a natural protective buffer between human activities and water supplies, helping to filter out pathogens, excess nutrients, metals, and sediments. Waste assimilation benefits were derived by the amount of forest, wetland, and riparian buffer cover.[21]
The nutrient category included 14 eco-prices, 11 of which are prices per pound of nutrient removed.[22] These were averaged, with the cost of implementing best management practices (BMP) cost share and cost of nutrient removal retrofits on water treatment facilities.[23] Also included in this category are the price of nitrogen in Pennsylvania’s nutrient trading market, and studies on the value of trees in reducing water treatment costs.[24, 25]
Stormwater and flood mitigation: Many natural landscapes provide a buffering function that protects humans from destructive activities. Forests, wetlands, riparian buffers, and floodplains mitigate the effects of floods by slowing, trapping, and containing stormwater. The stormwater and flood mitigation category comprises 27 eco-prices, 24 of which are stormwater best management practices that were averaged together.[26, 27]
Biological control: Native birds and insects dynamically regulate and control invasive and unwanted species, such as pests, weeds, and disease vectors (e.g., mosquitoes). This eco-price is based on a valuation study.[28]
Wildlife habitat: Contiguous patches of land cover with sufficient area allow naturally functioning ecosystems and support a diversity of sustainable plant and animal life. Intact forests and wetlands function as critical population sources for plant and animal species that humans value for both aesthetic and functional reasons. Native vegetation supports 29 times more biodiversity than non-native plants.[29]
The eco-price associated with biodiversity and wildlife habitat was assumed to be investments made to preserve natural lands or habitats and the tax benefit gained by doing so. The habitat category includes five instances of investments in wildlife habitat and the calculated average yearly tax benefit of donating land for conservation. The yearly value per acre is estimated to be this tax benefit, plus the average annualized value of the conserved land.[30, 31, 32, 33, 34, 35, 36, 37, 38, 39, 40]
Habitat regeneration: Natural habitats regenerate. Forests and wetland habitat regeneration is the act of renewing habitat cover by naturally establishing young plants promptly after the previous habitat has been altered. This eco-price is based on the cost to replace habitat using recent data from the U.S. Forest Service and two related studies.[41]
Aquatic habitat: The Pennsylvania Fish and Boat Commission (PFBC) created a wild trout designation and biomass classification system. PFBC also secures fines from activities that kill fish. Fines vary by species and fish size. Based on the average size and fine for different stream classifications, an eco-price was developed for each exceptional value and high-quality stream classification.[42, 43, 44]
Pollination: Pollination is essential for native vegetation, and many agricultural crops and substitutes for local pollinators are increasingly expensive. Pennsylvania has been experiencing a severe bee colony collapse. Forests and meadows provide pollination service benefits, which are a form of insurance for farmers and nature in the event that bee colony collapse remains an issue. This eco-price is based on the cost of replanting meadows, replacing beehives, and managing pollination in forests.[45, 46, 47]
Soil retention: Soils provide many of the services mentioned above, including water storage/filtration, waste assimilation, and a medium for plant growth. Natural systems create and enrich soil through weathering and decomposition, and retain soil by preventing it from being washed away. Four eco-prices are included in the soil category: two are costs of erosion and two are costs associated with preventing erosion.[48, 49, 50, 51]
Natural System Land Cover Types
Forests over 750 acres are sustainable forests that support breeding populations of migrating birds and larger mammals.[52]
Large regenerating forests are forests over 500 acres that support sustainable populations of songbirds and wildlife.[53, 54]
Working regenerating forests are actively harvested forests that occur on state lands. They can be small or large, with the average working forest being 200 acres. These forests generally regenerate, but have less habitat quality than larger, undisturbed forests.[55]
Forests under 150 acres (small forests) allow light to penetrate from all sides, thus promoting invasive species of plants. This retards natural regeneration. The services provided by these forests are useful only as long as these forests exist.[56]
Riparian forests (100 feet on either side of a stream) help stabilize banks and, due to the presence of water, attract wider biodiversity than upland forests. Some studies estimate the biodiversity to be double.[57, 58]
Urban forests can be any size, except in rare instances where the urban forest is large and connected—such as Fairmount Park in Philadelphia—where forests do not regenerate. The carbon and greenhouse gas value of these forests is significantly greater than other forests. These forests help with stormwater management, but they provide very little groundwater recharge.[59]
Floodplain forests are within the 100-year floodplain boundary.[60]
Headwater forests and wetlands (100 feet on either side of a stream), classified as first-order streams, are designated as having exceptional value and high quality. Headwaters often make up 50–70 percent of a watershed.[61] These streams have some of the cleanest water in Pennsylvania. The water provides an excellent habitat for native trout and other aquatic organisms.[62]
Forested wetlands have high biodiversity, as wildlife needs water for survival.[63]
Rural wetlands provide many biodiversity benefits. What distinguishes them is their location. While their benefits impact a smaller number of people, the downstream human population benefits from their existence.[64]
Urban wetlands impact urban populations. They have a limited role in groundwater recharge, as they are usually located at the base of streams.[65]
Cultivated fields can change vegetation from year to year; however, they do serve a value for many species of birds and other wildlife. They help to support pollinator species and biological control.[66] Cultivated fields can also be a source of sediment, pesticides, and fertilizers that pollute water.
Pastures support pollinator species and biological control.[67] Most state-endangered bird species are associated with pastures and wetlands. However, pastures can be a source of pollution, because the soils are compacted and provide only a small value in runoff control.[68]
Open water is great for recreation and provides groundwater recharge. Birds and other wildlife use water as part of their regular and migration habitats.[69]
Developed open space includes parks and preserves with less than 30 percent impervious cover. Urban open space and street trees provide many benefits, including air quality, energy conservation, cooling, and pavement protection. They also can provide a habitat for many species, as long as a larger habitat is within a half mile.[70]
Developed lands are urban areas with greater than 30 percent impervious cover. These areas often create more problems than benefits for natural systems.[71]
Air Pollution Removal
The Clean Air Act (CAA) requires the Environmental Protection Agency (EPA) to set National Ambient Air Quality Standards (NAAQS) for pollutants considered harmful to public health and the environment. A nonattainment area is any area that does not meet primary or secondary NAAQS. Once a nonattainment area meets the standards and additional re-designation requirements in the CAA [Section 107(d)(3)(E)], the EPA will designate the area as a maintenance area.
Ozone is formed by chemical reactions occurring under specific atmospheric conditions. Precursor pollutants that contribute to the formation of ozone include volatile organic compounds (VOCs) and oxides of nitrogen (NOx), both of which are components of vehicle exhaust. VOCs may also be produced through the evaporation of vehicle fuel, as well as by displacement of vapors in the gas tank during refueling. By controlling VOC and NOx emissions, ozone formation can be mitigated. Both precursor pollutants are analyzed in the transportation conformity process. Air pollution can also damage buildings and plants, disrupt many natural system services, and cause reduced visibility.
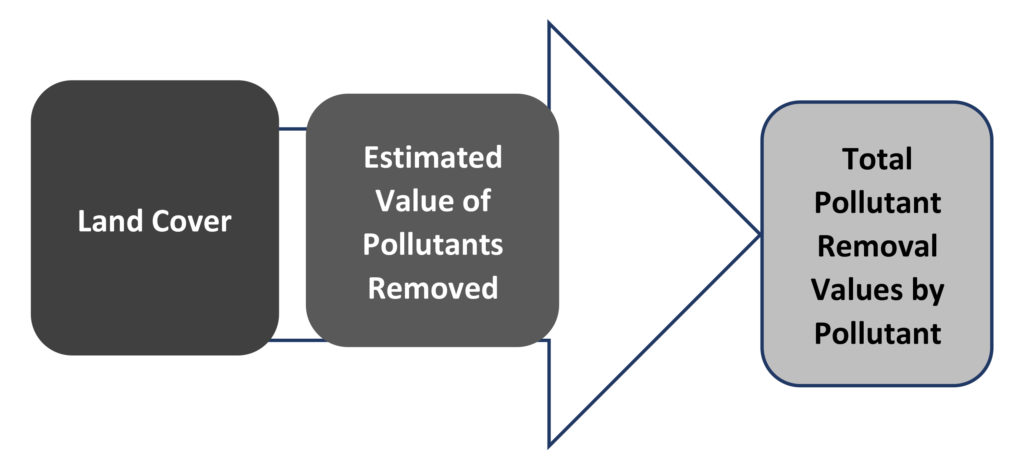
Total pollutant removal values for each pollutant vary depending on the amount of tree-canopy cover. Increased tree cover leads to greater pollutant removal values. As trees die and decay, they release much of their stored carbon into the atmosphere. Carbon storage is an estimate of the total amount of carbon that is currently stored in the above- and below-ground biomass of a forest.[72]
The i-Tree Landscape Model, developed by the U.S. Forest Service, was used to estimate the air pollution removal and carbon sequestration and storage rates of tree cover. The model uses the National Land Cover Database to estimate the amount of tree canopy, and then uses pollution-removal rates to estimate the total amount of pollutant removal. The i-Tree Landscape analyzes tree canopy, land cover, and basic demographic information by specific locations. With the information provided by the i-Tree Landscape Model, levels and financial value are calculated.[73]
FIGURE 3
I-TREE LANDSCAPE MODEL PROCESS
Outdoor Recreation
Outdoor recreation includes activities that can be performed in natural settings without causing harm to nature. Resident levels of participation and direct annual spending are tracked across 13 recreational activity categories. This list was compiled by reviewing the major activities in the DCNR 2014 Outdoor Recreation Participation Survey, and by having discussions with steering committee members. Only those activities with the highest participation rates are included. Some residents may enjoy horseback riding, but the numbers are small relative to other activities. Further, motorized activities like motorcycling, snowmobiling, and driving for pleasure are not included, as these are long-distance activities associated with tourism. The major recreational activities are:
- Freshwater fishing
- Hunting (all types)
- Walking (on trails, in parks, and on streets)
- Running (on- and off-road)
- Bicycle-based recreation (on- or off-road)
- Camp-based recreation (in a tent)
- Water-based recreation (kayaking, rafting, and canoeing)
- Trail-based recreation (hiking on an unpaved trail, backpacking, and climbing natural rock)
- Wildlife viewing (wildlife watching and photography, except birds)
- Birding (both near and away from home), bird feeding, bird watching, and photography
- Outdoor education (nature study)
- Mountain biking
- Cross-country skiing
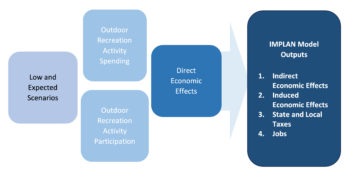
Economic Impact Analysis for Planning (IMPLAN) is an economic impact assessment software system used to assess the change in overall economic activity as a result of change in one or several specific economic activities. Economic activity can be either outside the region or reflected in transactions among people and businesses. This form of economic activity is often referred to as economic contributions.
Economic contributions are usually expressed as jobs, income, retail sales (expenditures), and tax revenues. For the purpose of economic modeling, economic contributions and impacts can be divided into three standard components: direct, indirect, and induced. Indirect and induced effects are the two components of the multiplier or ripple effect. Each of these is considered when estimating the overall economic effect of any activity.
Direct effects are initial purchases made by the consumer, and calculated by multiplying the number of participants by their average annual spending for a particular activity. Participants are defined as those who engage in a given activity at least once a year, and their recreational activity spending includes such things as travel, clothing, equipment, and fees.
Indirect effects measure how sales in one industry affect the other industries that provide supplies and support. For example, an angler buys fishing rods, hats, hip boots, gasoline, and food—which may be produced in other parts of the state, country, or world.
Induced effects result from the wages and salaries paid by impacted industries to employees who then spend their money. These expenditures are induced effects that create a continual cycle of indirect and induced effects.
The sum of the direct, indirect, and induced effects is the total economic impact or contribution. The IMPLAN economic model examines economic and demographic data. Indirect and induced economic effects, along with employment and state and local taxes, are analyzed for the 13 previously identified outdoor recreation activities.[74]
FIGURE 4
IMPLAN ECONOMIC IMPACT ASSESSMENT TOOL
The first phase of this analysis focused on data gathering that included:
- Researching existing published surveys that collected information on regional, state, and national participation and spending estimates
- Estimating the total annual expenditures made by recreationists at the local, regional, and national levels for each examined category
- Interviewing local experts on each activity to validate the survey data for participation and spending
- Creating a set of expected estimates for participation and spending
While not all surveys collect information in the same data categories, there are some consistencies. Most surveys provide information on a majority of activities, participation rates, and spending. The rate of participation and levels of spending depend on recreational activity. Statistics on some activities are difficult to collect. Transaction receipts are impractical, if not impossible, to collect. Therefore, the primary sources of information are surveys. Recreation surveys generally accept respondent estimates without validation and, since outdoor recreation is considered a desirable activity, respondents may overestimate their participation.
Most surveys ask people about their activities over the previous seven days, two weeks, or even a year. A natural inability to recall behavior over periods of time, combined with a tendency to remember recent events more accurately, can lead to overestimates. Nevertheless, surveys do indicate trends, several surveys may have similar outcomes, and local experts and users can help validate survey results. Creating scenarios allows results to be bracketed and presented with an accurate range of economic impacts.
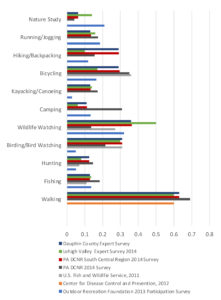
Financial data is less available than participation rates and usually derived from surveys and national studies. For example, the U.S. Fish and Wildlife Service conducts a National Survey of Fishing, Hunting, and Wildlife-Associated Recreation (FHWAR) every five years. This survey breaks down spending, demographic, and participation information, and provides information on a state-by-state basis. This survey is a well-established reference for fishing, hunting, and wildlife watching.[75]
FIGURE 5
COMPARISON OF NATIONAL, STATE, AND REGIONAL SURVEY PARTICIPATION RATES
Reduced Healthcare Costs
Healthcare savings are derived by applying DCNR outdoor exercise participation rates to the conclusions of four recent studies. Outdoor recreation activities include walking, hiking, jogging, running, bicycling, camping, unstructured and playground play, paddle sports, bird and other animal watching, wildlife photography, hunting and fishing, and nature study. These activities are provided by open space at little or no direct cost to users. While paid fitness clubs and prescription exercise are valuable, individuals are generally actively involved for only a short time—often just three to six months.[76]
KEY FINDINGS
- A 2012 collaborative study of over 20,000 people between the University of Texas-Southwestern Medical Center and the Cooper Institute found that average medical claims spent for middle-aged, least-fit men were about 37 percent higher ($5,134) than the average spent per year for most-fit men ($3,227). The most-fit males saved $1,907 in medical costs per year. The average medical claims spent for least-fit women were 40 percent higher ($4,565) than the most-fit ($2,755). The most-fit females saved $1,810 in medical costs per year.[77]
- A University of Michigan study looked at the impact of exercise on 4,345 employees in a financial services company that started a workplace wellness program. Roughly 30 percent of employees were high risk and suffering from metabolic syndrome, a dangerous cluster of risk factors associated with diabetes and heart disease. Overall, about 34 percent of U.S. adults have metabolic syndrome. The study found that when high-risk employees accumulated the government-recommended 150 minutes of moderate-intensity exercise a week, their healthcare costs and productivity equaled that of healthy employees who didn’t exercise enough. Employees with metabolic syndrome who exercised enough cost $2,770 in total healthcare annually, compared to $3,855 for workers with metabolic syndrome who didn’t exercise enough. Pharmacy costs alone were twice as much. This represents a savings of $1,085 per person per year.[78]
- A 2015 study about “Inadequate Physical Activity and Health Care Expenditures in the United States” included 51,165 adults over the age of 21, excluding women that were pregnant or people who were unable to be physically active. The study found that the mean annual expenditure difference per capita for inactive adults compared to active adults was $1,437, or a difference of 29.9 percent. For people who exercised, but not enough to sufficiently reach maximum benefit, the difference was $713 per year.[79]
- In 2016, The Centers for Disease Control and Prevention (CDC) published a paper connecting inadequate physical activity with healthcare costs. The CDC researchers merged data from the National Health Interview Survey (2001-2010) and the Medical Expenditure Panel Survey. The National Health Interview Survey used face-to-face interviews to gather health information from individuals nationwide. The Medical Expenditure Panel Survey collected healthcare cost data from both federal agencies and private insurance companies. When these two data sets were merged, information was provided on over 58,000 individuals. The researchers evaluated the difference in healthcare costs for individuals with various levels of physical activity. Individuals who exercised more than 150 minutes per week spent about $4,500 per year on healthcare costs. Those who did between zero and 150 minutes of exercise a week spent $5,076 per year, and those who didn’t exercise at all spent $5,813 per year. Compared with those who are active, sedentary adults spend $1,313 more on healthcare every year.[80]
The conclusions of these four studies are compiled to establish an average per-capita healthcare cost reduction.
FIGURE 6
HEALTHCARE COST REDUCTION DUE TO EXERCISE AND OUTDOOR ACTIVITY
| Source | Annual per capita expense | |
| 1 | Holohan, 2012 | $1,907 |
| 2 | Bailey, et al., 2014 | $1,085 |
| 3 | Carlson, et al., 2015 | $1,437 |
| 4 | CDC, 2016 | $1,313 |
| Average cost reduction | $1,436 | |
| Insufficient exercise to reach maximum benefit (Carlson, et al., 2015) | $713 | |
Property Values
ROE analyses typically include a calculation of the residential real estate premium due to proximity to open space. That is, how much more valuable is the housing stock because homes are next to or near open space?
Existing open space adds to the overall value of its housing stock. This increased wealth is captured by citizens through higher sale values of homes near open space, and increased government revenues via larger property tax collections and transfer taxes at the time of sale. However, proximity to open space may not have a significant impact on property values in more rural areas.
Being near surface water, on the other hand, can make a difference in the value of housing stock. For example, existing research demonstrates that lakes can bring recreational and aesthetic value to surrounding properties, which has economic and fiscal implications due to increased property and tax assessment values.
- Nationally, waterfront homes are worth more than double the value of homes overall. According to 2014 median home value data provided by Zillow for 247 cities throughout the U.S., the value of a single-family home was $282,577, while the average value of a waterfront single-family home was $697,920—a difference of more than 235 percent.[81]
- Lakes can influence the property values of surrounding homes, particularly for those closest to the lake. A 2012 analysis of property values and tax revenues in Kosciusko County, IN, found that properties within 500 feet of the county’s 41 largest lakes accounted for 37 percent of total property tax revenues. A 1995 hedonic study conducted in Central Texas found several statistically significant recreational and aesthetic (RA) characteristics of housing, with proximity to the lake being the most important. Specifically, the study found that waterfront properties captured 75 percent of the RA value for all homes within 2,000 feet of a lake. Beyond the waterfront, the marginal RA price falls rapidly with increasing distance.[82]
- Based on other research in Pennsylvania, property values in rural counties were highest for those homes within 500 feet of a lake. This waterfront premium represents an increase of 15 to 35 percent of average total assessed property values within each jurisdiction. Although this analysis does not account for differences in home size, quality, and other characteristics, which may partially explain value disparities between waterfront and non-waterfront homes, research suggests that a significant portion of this waterfront premium is likely attributed to lake proximity.
Conversely, property values and tax revenues are subject to change based on improved or degraded water quality. A 2003 analysis conducted in Maine found that a one-meter decrease in water clarity causes property values to decrease 3 to 9 percent. Similar effects were seen in New Hampshire and Vermont, and there is indication that this effect holds true in Pennsylvania.[83]